
The growth gap
How each store size and category really did this year.
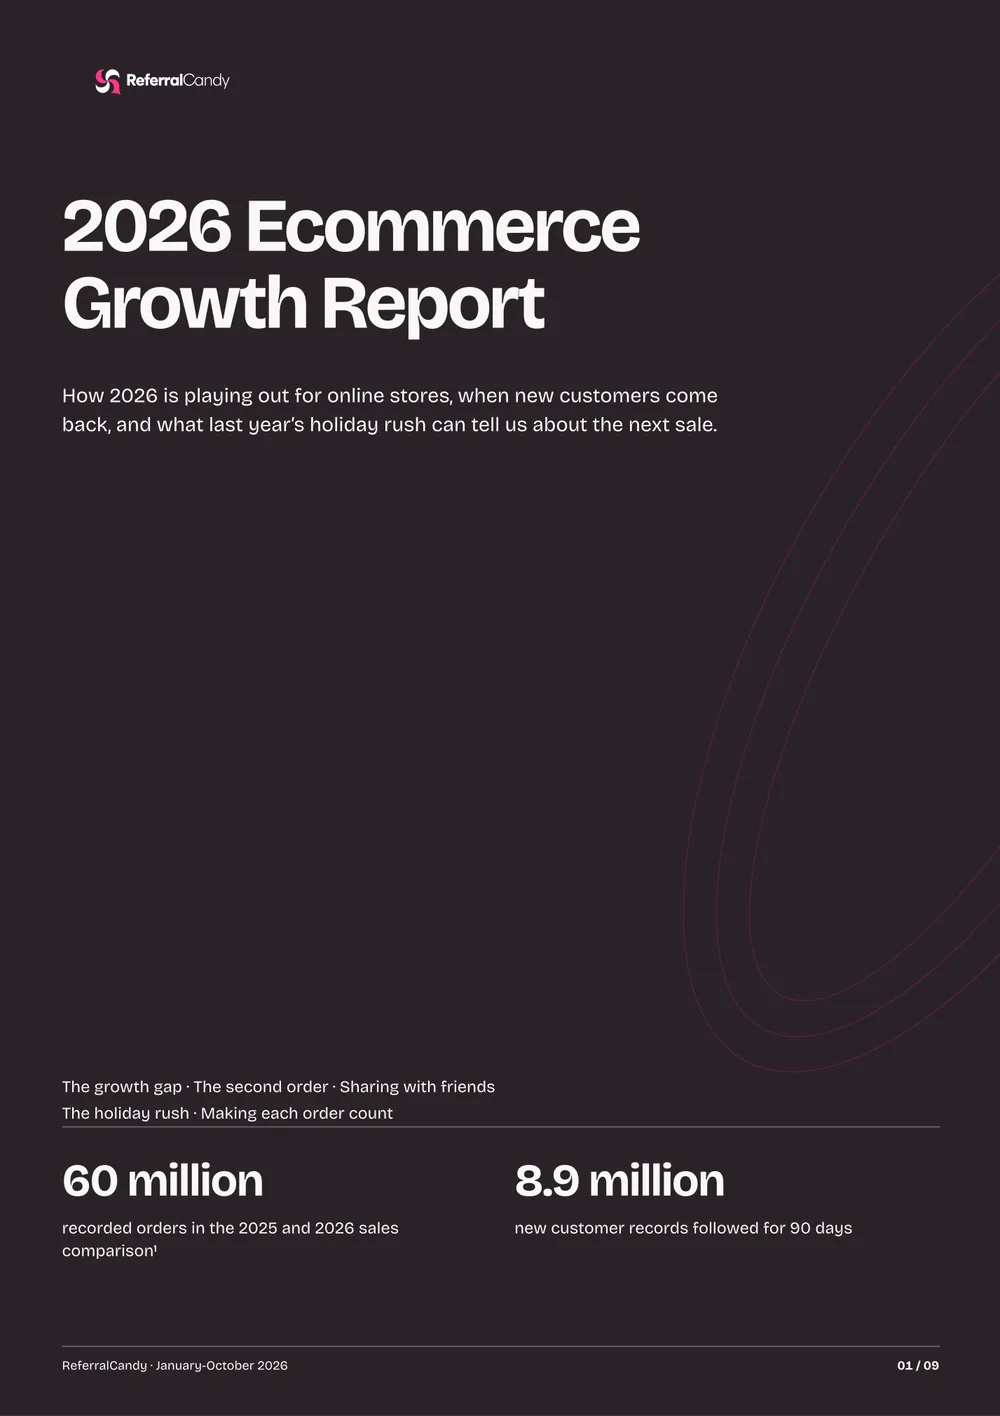
We compared 60 million recorded orders from 2025 and 2026, store by store. What we found changes how you should judge your own year. Get the free 2026 Ecommerce Growth Report before you plan your next sale.
Free 9-page PDF · Sent to your inbox
The report breaks 2026 down by store size and by what you sell, so you can see who pulled ahead, who fell behind, and where your store sits.
Order values changed this year. The report looks at how much of that could simply be inflation.
See how apparel, beauty, food, health and home stores did, from the smallest to the busiest.
Average monthly orders in 2025 · median change, Jan–Oct 2026 vs 2025
| Store size | Orders | Order value |
|---|---|---|
| Under 100 | Locked | Locked |
| 100–499 | Locked | Locked |
| 500–999 | Locked | Locked |
| 1,000–4,999 | Locked | Locked |
| 5,000 or more | Locked | Locked |
Tell us about your store and we’ll show you exactly what the report compares you against.
Your average monthly orders in 2025
How did your orders change this year?
Your store
100–499 orders a month
Stores your size
100–499 orders a month
How did your year go? Pick an answer above to see how you’ll be compared.
How each store size and category really did this year.
How many new customers buy again within 90 days, and how long they take to do it.
Where customers actually click when they share a referral: email, messaging or social.
What Black Friday 2025 did to daily orders and order value, category by category.
How many items go into each order, and how often a checkout turns into a purchase.

 9 pages, unlocked by email
Do you know what last year’s rush did to orders and order value for stores like yours? The report does, category by category. Get it before your next sale.
Based on activity recorded through ReferralCandy, January–October 2026. No individual business or customer is named.